

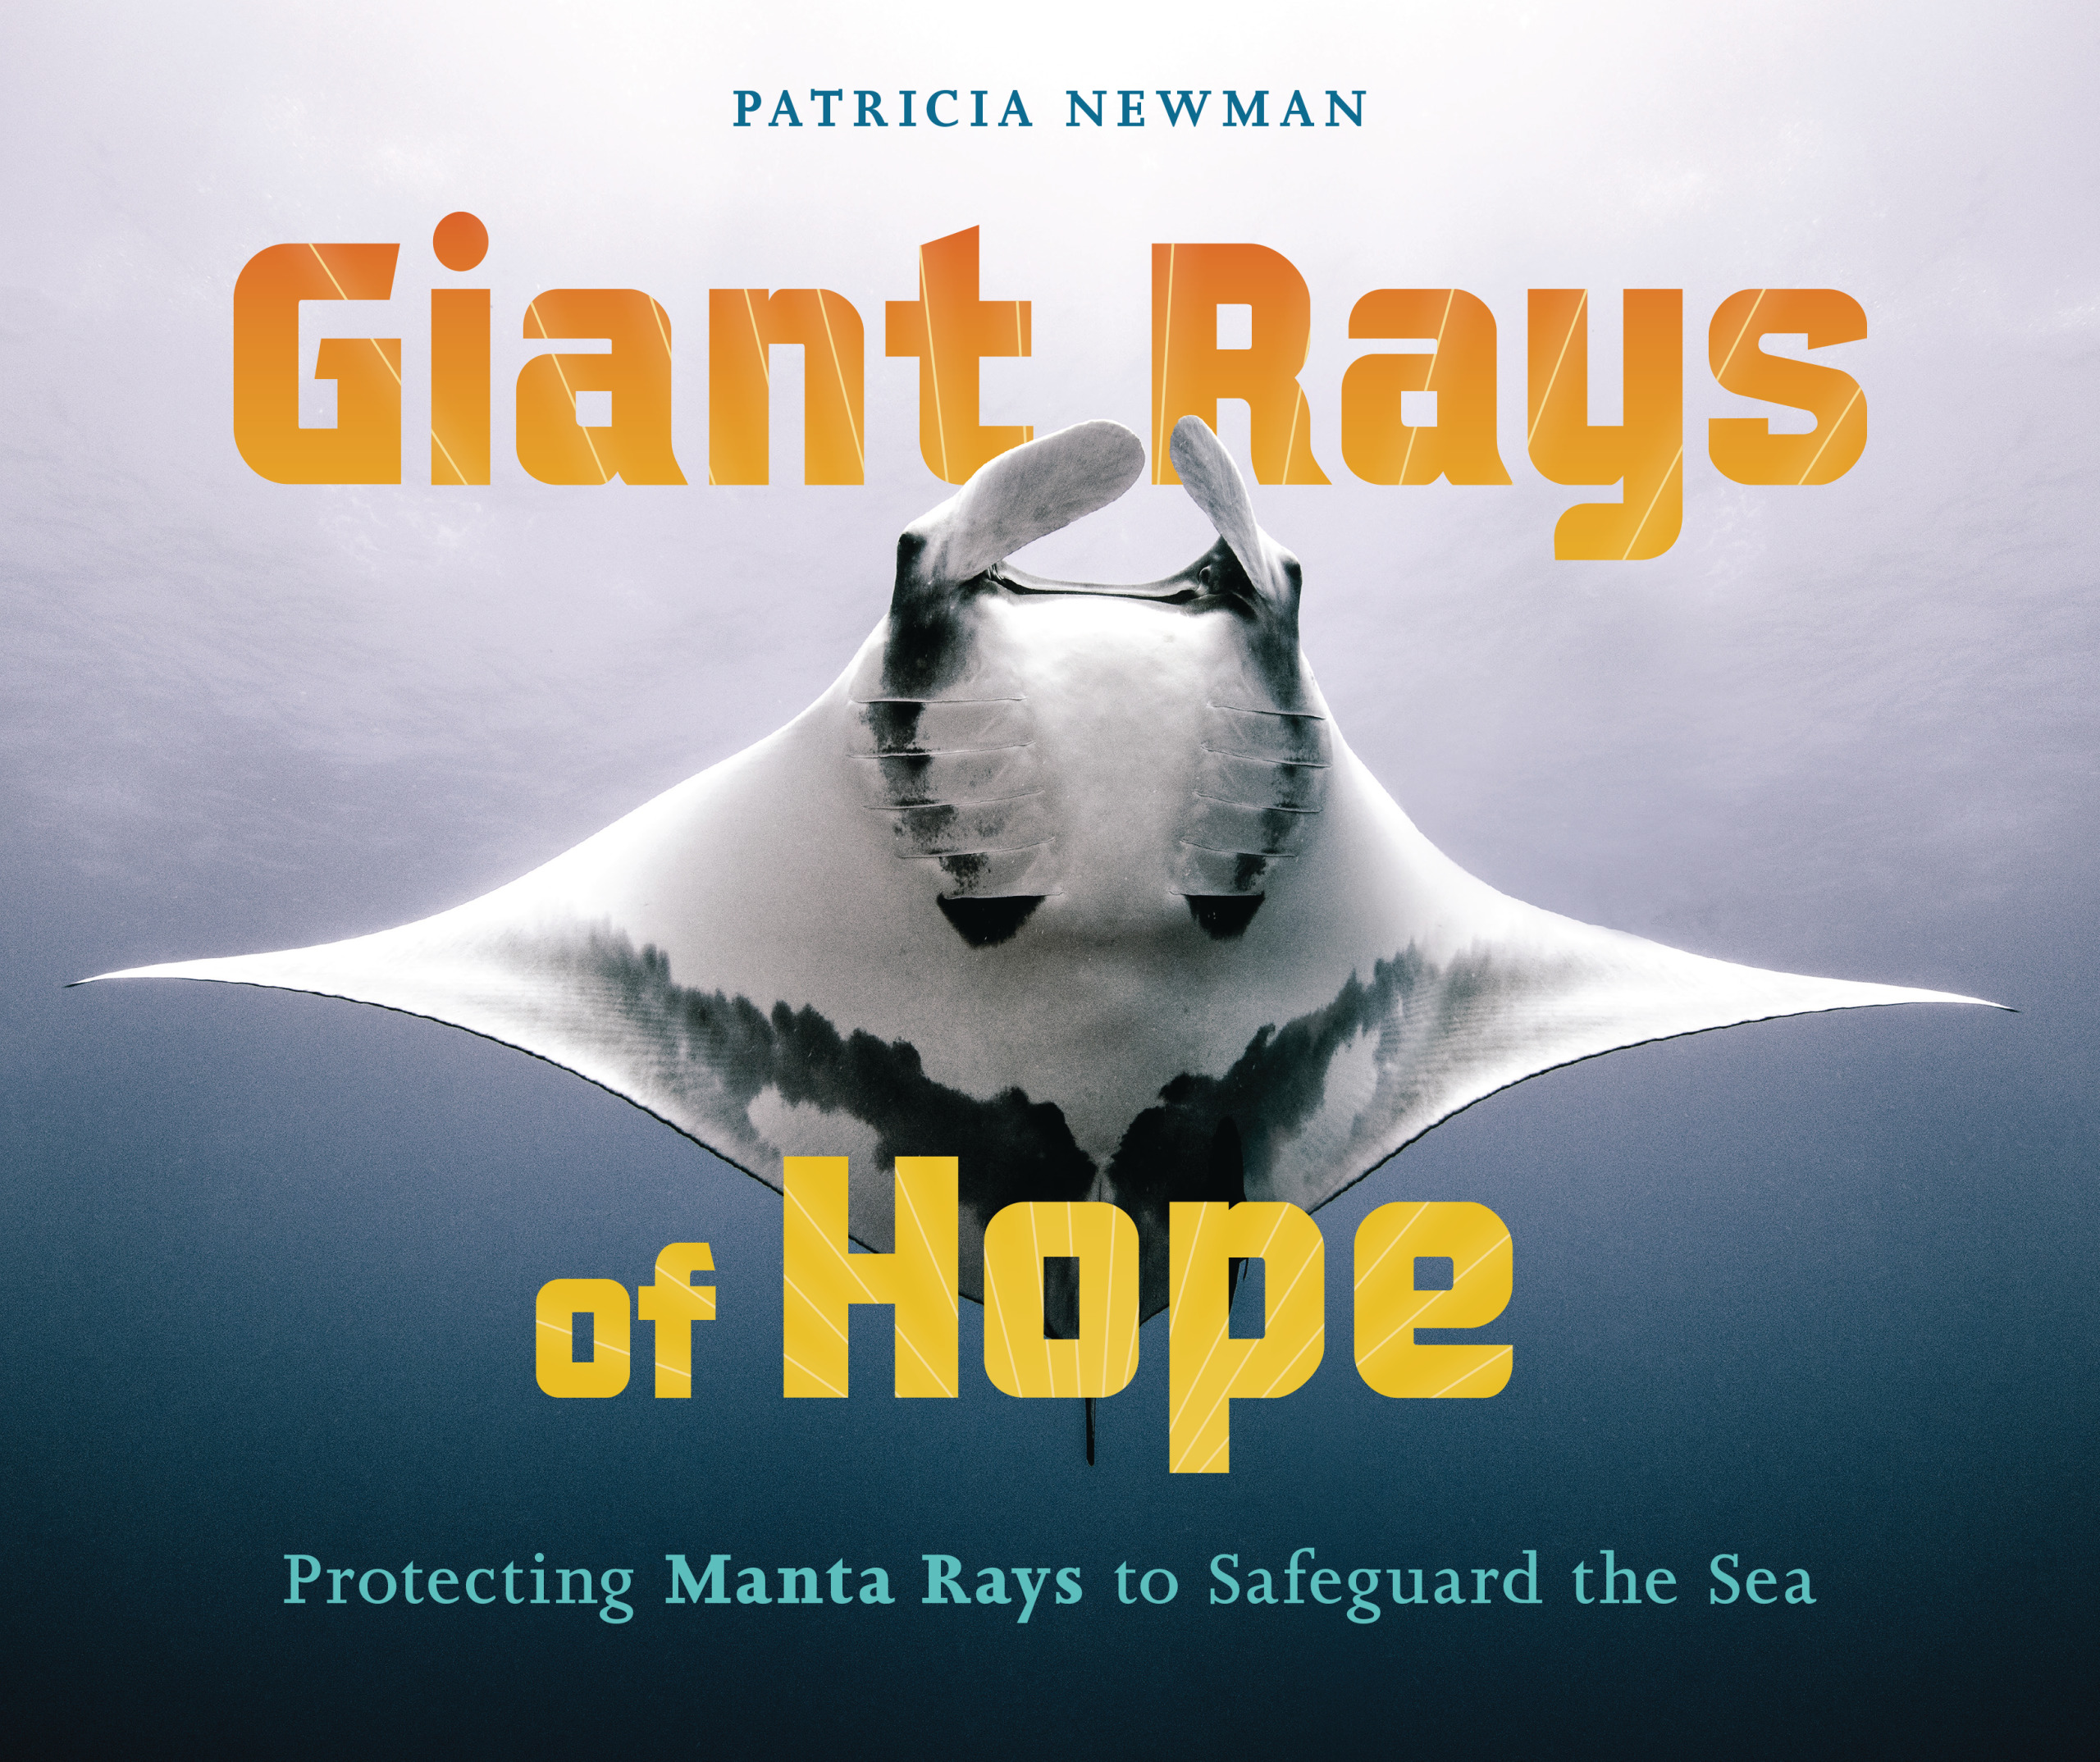
BY PATRICIA NEWMAN
Thank you to Maria Dietz, a Teacher Librarian at Merced City Schools in California, for masterminding this terrific lesson that has students plotting data on coordinate planes and analyzing that data to make conservation decisions.
Preparation
Introduce students to Giant Rays of Hope: Protecting Manta Rays to Safeguard the Sea. Help them discover why Kerstin Forsberg’s approach to conservation is so unique.
Possible discussion questions include:
- Why are giant manta rays an important part of the Peruvian coast?
- What did you learn about a fisher’s life?
- How do fishers and giant manta rays inteact?
- List some of the ways that Kerstin used giant manta rays to help interest her communities in protecting the ocean.
Engage, part 1 – 20 minutes
After reading chapter 2 of Giant Rays of Hope, go to MantaTrust.org and display the webpage to the group. On the top right side, select ID the Manta, scroll down to Spot the Difference. Show students the unique spotting on the manta’s ventral side. Reiterate how this uniqueness is like our own fingerprints.
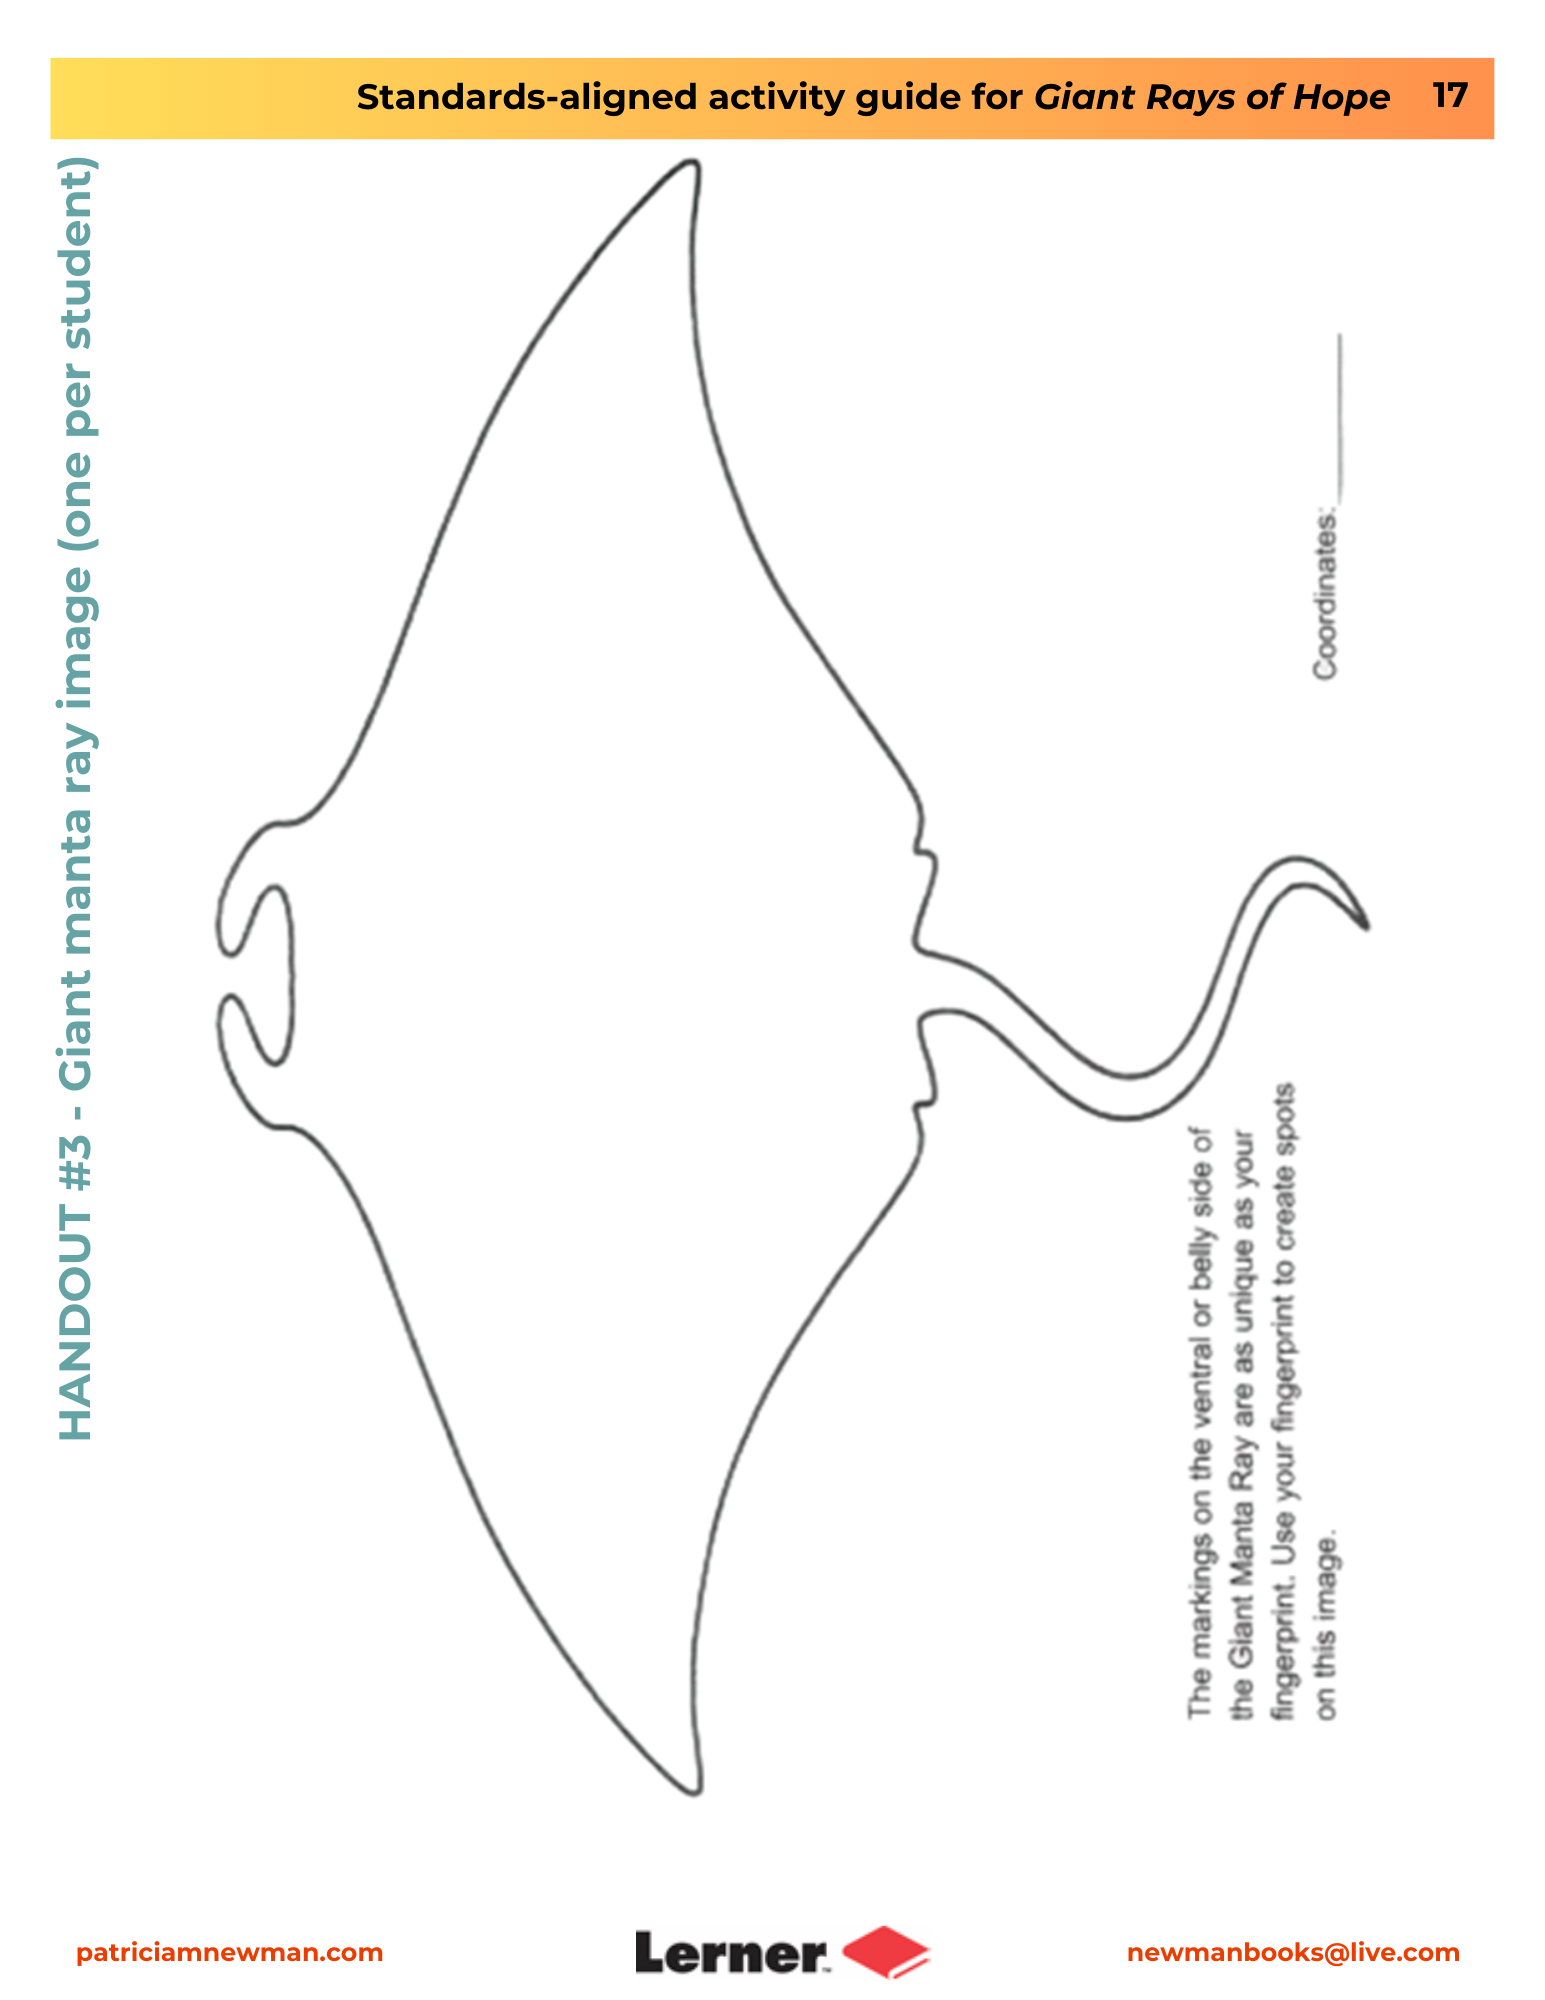
Provide each student with Handout #3 and an ink pad. (All handouts are pictured in this blog post, but may be downloaded from my website.)
Direct each student to use a finger or thumb to make a unique ink fingerprint pattern on the belly or ventral side of their manta. Have students write their names on the back of their papers.
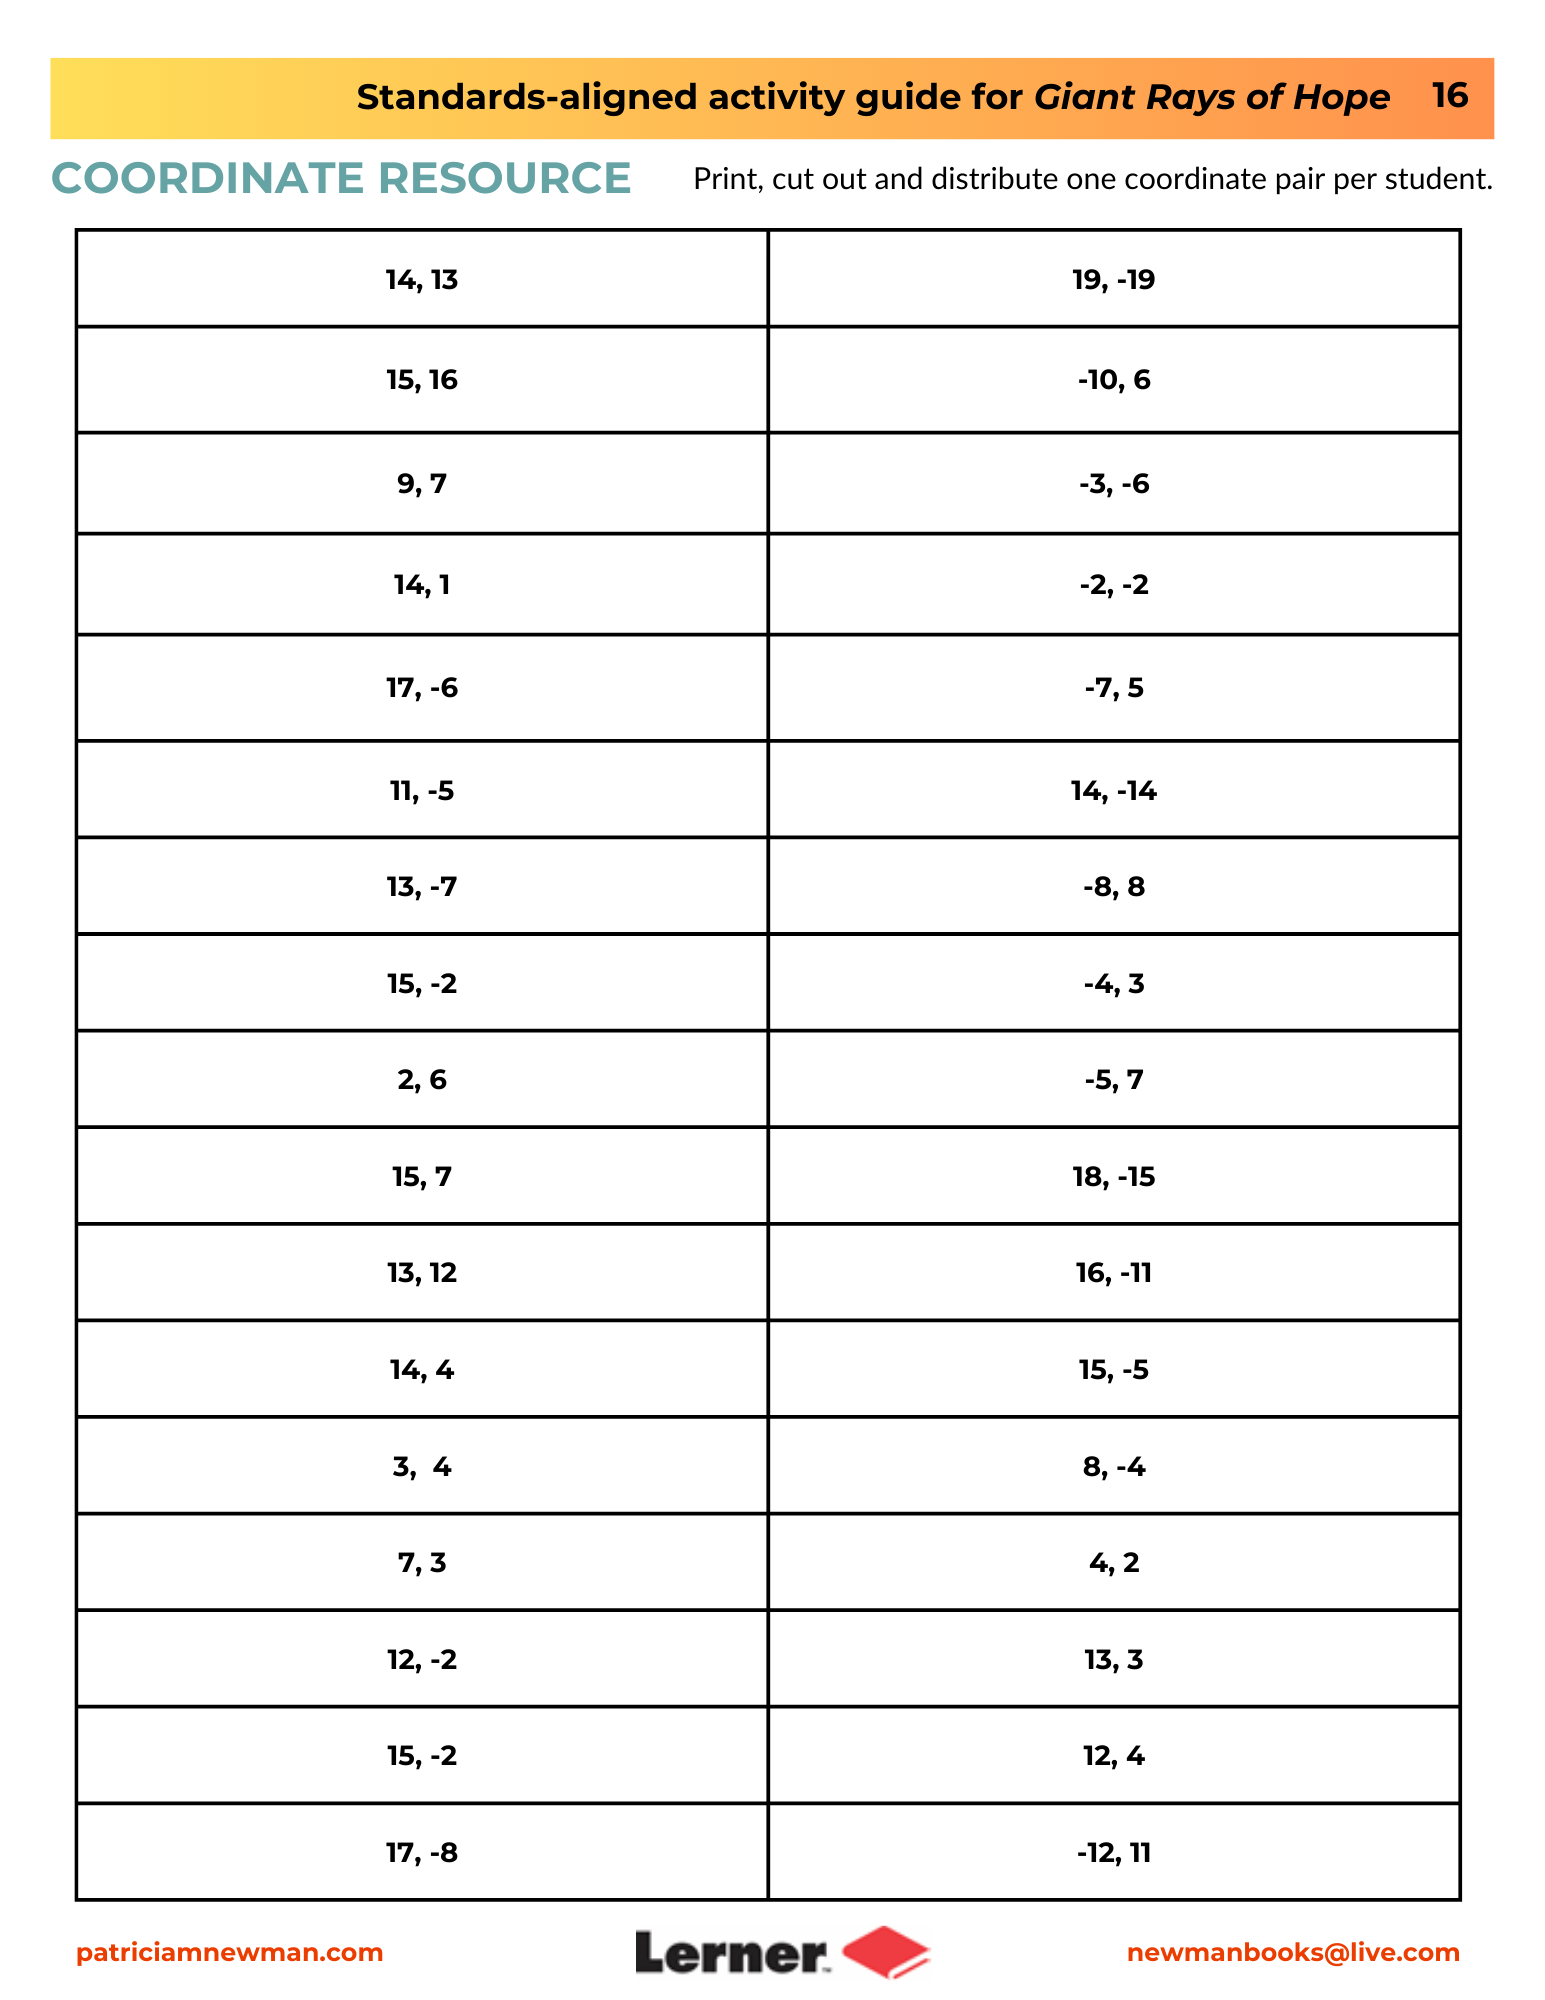
Cut the coordinates from the Coordinates Resource page. Give each student a coordinate pair.
Direct students to write the coordinate pair on the designated blank next to their manta ray.
Engage, part 2 – 45 minutes
Hang up the personalized mantas around your room/playground/school, whatever works for your situation.
Establish a set time for students to complete the task. Ten minutes for a classroom will be sufficient; more time when using a larger area.
Elaborate
Reference page 27 of Giant Rays of Hope. The fishers suggested reporting manta ray sightings to help prevent them being caught in fishing nets. The students will become the fishers and record sightings of manta rays.
Divide students into “fishing boats” a.k.a. small groups or pairs.
Provide them with Handout #4. (Note: All handouts are pictured in this blog post, but may be downloaded from my website.) There is a space to draw the spots on the manta and a blank for the coordinates. Model how to record the manta and its coordinates. While the drawing is not critical for the rest of the lesson, biological illustration is one method scientists use to record and communicate visual observations.
Set a time limit according to your space.The playground would be ideal so that the manta rays are spaced apart. Each fishing boat should send members to different areas to look for manta rays.

Explain
Call all your fishers back to their dock (table group) because they will now become scientists who will plot and analyze the data.
Display a coordinate grid and model how to plot x and y coordinates on the four quadrants. This should be a review of the skill.
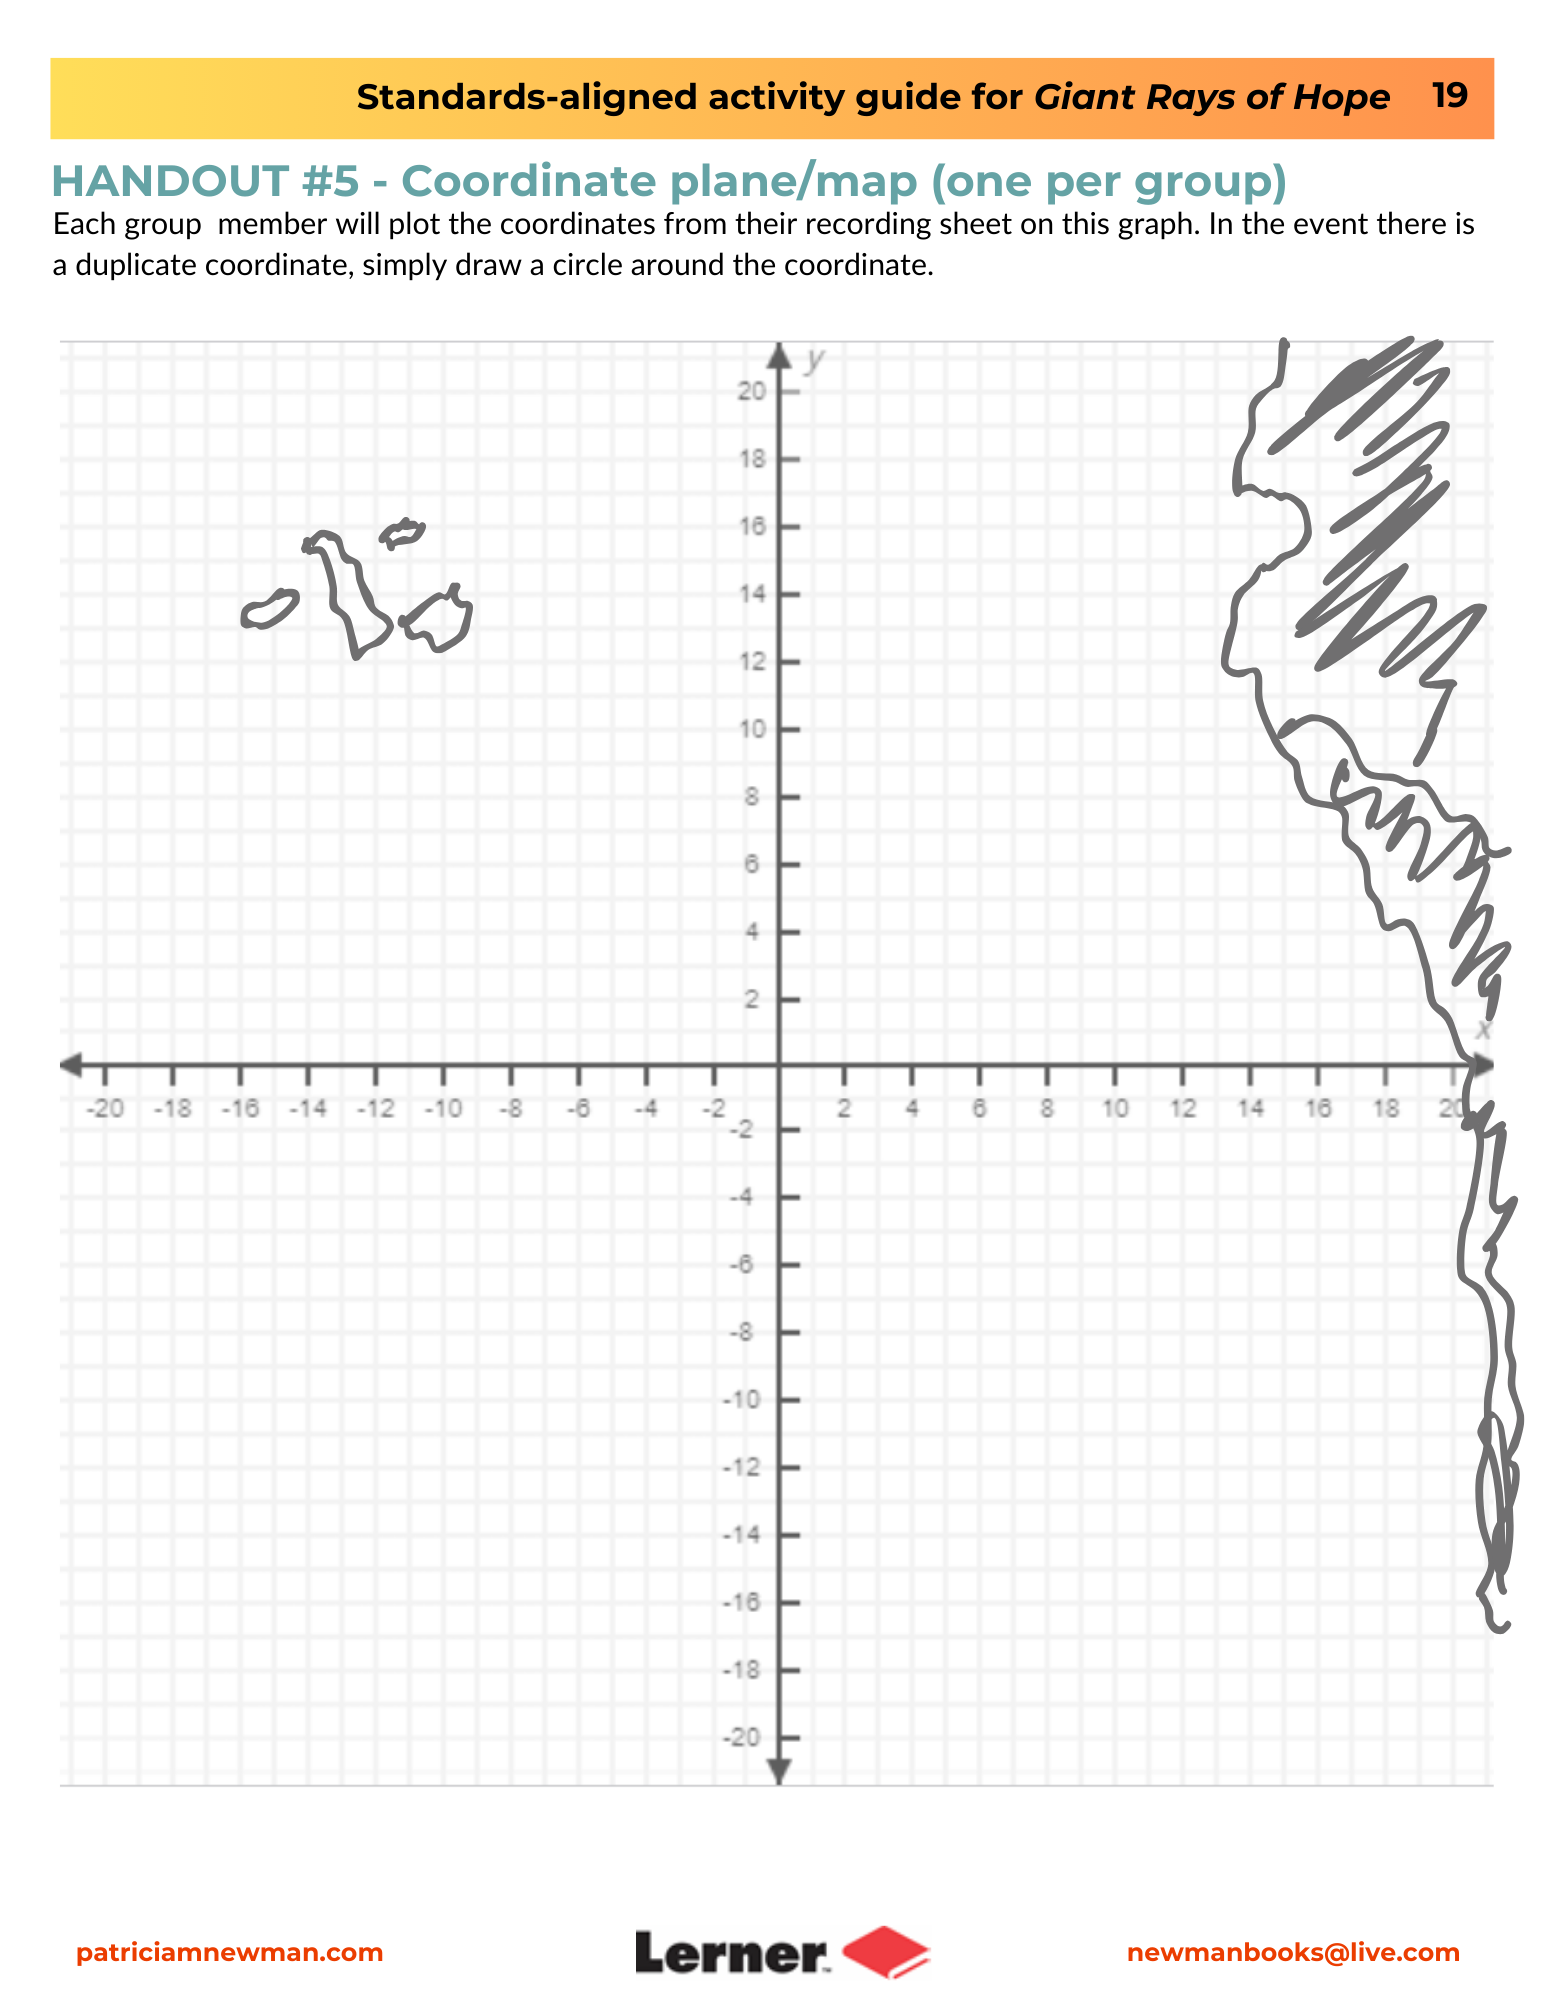
Distribute Handout #5, one copy for each group. (Note: All handouts are pictured in this blog post, but may be downloaded from my website.) Using the group’s collected data, students within the group will plot their sightings on the same coordinate plane. This will yield more “sightings”. If the same coordinate has been recorded by more than one student, they should draw a circle around the plotted coordinate.
Ask students to explain where manta rays are found.
Elaborate and evaluate
Gather and display all of the coordinate planes. Facilitate the sharing of student’s observations of their own data compared to that of other groups. You can use the prompts below as a guide:
- What math skill did we use to determine where the manta rays are located?
- Consider the locations of the coordinates on the map. Do you notice any patterns or trends?
- What could be drawing the manta rays to these locations?
- How might fishers use the manta rays’ location coordinates?
- How might the manta rays’ presence or absence in these locations impact the ecosystem?
- What conclusions, if any, can you draw from your data in terms of establishing a marine protected area?
Standards addressed
Common Core
CCSS.MATH.CONTENT.6.G.A.3- Draw polygons in the coordinate plane given coordinates for the vertices; use coordinates to find the length of a side joining points with the same first coordinate or the same second coordinate. Apply these techniques in the context of solving real-world and mathematical problems.
NGSS Standards
- MS-ESS3-3: Apply scientific principles to design a method for monitoring and minimizing a human impact on the environment
- Disciplinary Core Idea
- Human Impacts on the Environment
- Science and Engineering Practices
- Constructing Explanatios and Designing Solutions
- Crosscutting Concepts
- Cause and effect
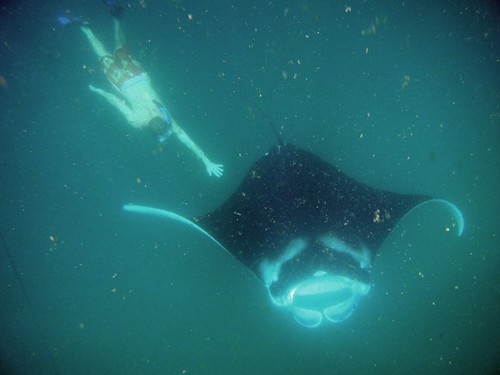
Featured image credit: “Jamie-swims-with-the-fishes”-by-behang-is-licensed-under-CC-BY-NC-ND.


Leave a Reply
Your email is safe with me.